

Gain valuable insights into town halls and their audiences with reports and analytics in Microsoft Teams. View and export data from a town hall, including the viewer count, presenter performance metrics, and more.
Events View and Presenters View share insights about different groups during the event: Events View shows data about your audience, while Presenters View shows data about presenter streams.
In this article
Real-time organizer analytics
[!NOTES]
- Real-time organizer analytics is an advanced feature available in events with up to 3,000 attendees. For use of this feature in larger events, contact your IT admin.
- If you had Teams Premium prior to April 1, 2026, you'll continue to have access to this feature in events up to 100,000 attendees until the expiration of your license. To learn more about Teams licensing for events, please contact your IT admin.
During a town hall, organizers and co-organizers can see real-time event analytics like viewer count, attendees’ country or region, and more.
Event view
The Event View displays several data widgets: summary tiles, charts and graphs, a breakdowns table, and a viewing experience timeline.
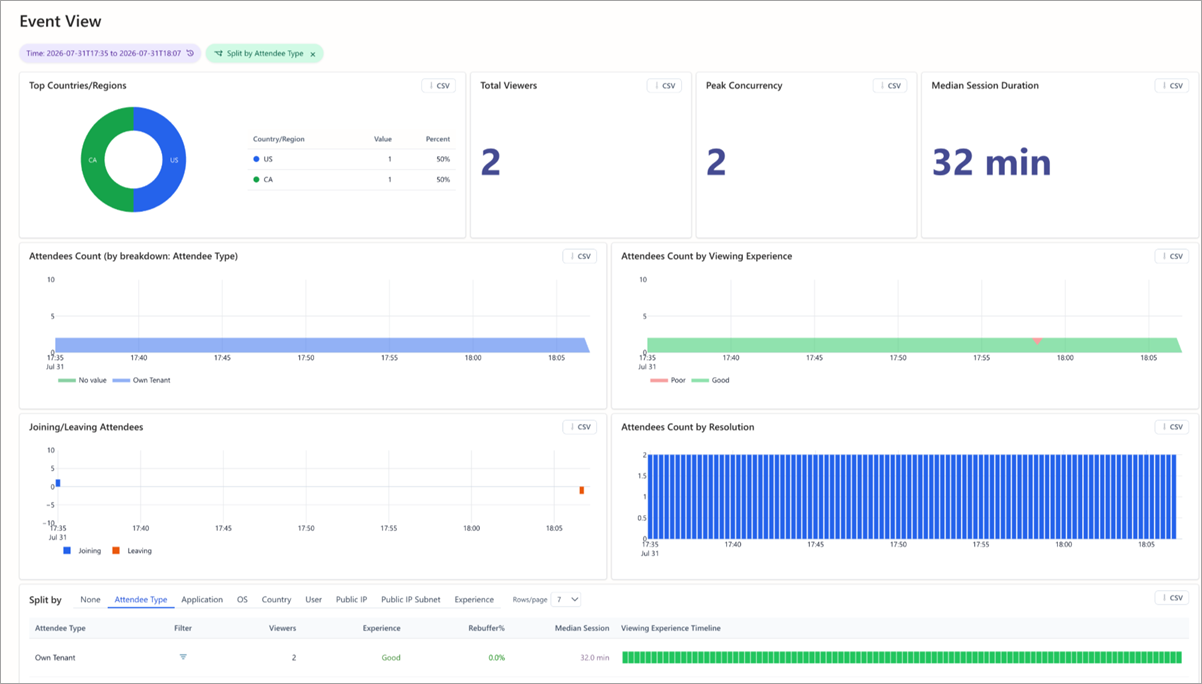
View reports pertaining to the whole event or for specific segments of an event. To narrow your reporting timeframe, select Time at the top of the page and specify a time window.
Summary tiles
View tiles at the top of Event View for a quick summary of the event.
- The Top Countries/Regions tile shows a breakdown of countries from which the audience viewed the town hall.
- The Total Viewers tile shows the number of people who watched the town hall.
- The Peak Concurrency tile shows the highest number of viewers connected at the same time.
- The Median Session Duration tile shows the median length of time viewers spent connected to the event.
Charts and graphs
Five overview charts show the core metrics of a town hall.
- Attendees Count shows how many viewers connected to the event over time. The chart follows your Split by selection and shows viewers included in a specific breakdown, such as Attendee Type.
- Top Countries/Regions shows the distribution of viewers by country or region, with the viewer count and percentage of each.
- Joining/Leaving Attendees shows whether attendees join, refresh, or leave at certain points during the event.
- Attendees count by Viewing Experience shows whether viewers are having a good experience (green) or poor experience (orange).
- Attendees Count by Resolution shows how many viewers watched at different video resolution levels over the course of the event.
Breakdowns tables
The breakdowns table provides a detailed breakdown by dimension, including viewer count, experience, rebuffering percentage, and median session length.
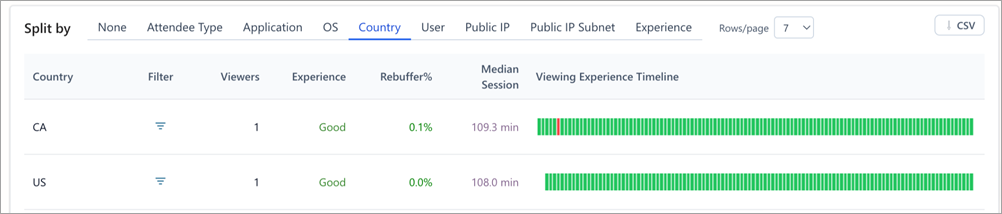
Choose a dimension with the Split by control above the table, filter to a particular value with the Filter row, and use Rows/page to control how many rows are shown per page of the table.
Split by options include:
- None: Shows all viewers.
- Attendee type: Groups viewers based on their org (same org, guest, etc.).
- Application: Groups viewers based on the application they’re viewing with (i.e., Microsoft Edge, Teams for desktop, etc.).
- OS: Groups viewers by their operating systems.
- Country/Region: Shows viewers based on regions.
- User: Lists viewers individually by their Azure Active Directory (AAD) object ID.
- Public IP: Groups viewers by their public IP address.
- Public IP Subnet: Groups viewers by the first three octets of their public IP address.
- Viewing experience: Groups viewers by their experience (good or poor).
When you split by attendee type, the groups are:
- Own tenant: Attendees from your org.
- Cross-tenant: Attendees from outside your org who are authenticated (signed into an account before joining the town hall).
- Guests: Attendees from outside your org who are anonymous or unauthenticated (not signed into an account before joining the town hall).
Viewing experience timeline
The viewing experience timeline shows when attendees were having a good or poor viewing experience during a town hall. This is generated based on whether attendees experienced rebuffering or still video frames.
| Rebuffering % | Color code | Determination |
|---|---|---|
| Less than 2.5% | Green | An experience is considered good when there is less than 2.5% rebuffering during the event. |
| More than 2.5% | Orange | An experience is considered poor when there is more than 2.5% rebuffering and a substantial user base is represented. |
You can view timeline data based on different dimensions.
To see more detailed data, highlight a portion of a graph by clicking and dragging your cursor over the section you want more details about. When you release, the data will refresh to only reflect the highlighted time range.
Access and export analytics
To access real-time analytics:
- Select Calendar
 in Teams.
 - Open a town hall.
- Select Manage event
 .
. - Go to Reports and select View event insights
 .
.
Data will be available once the town hall starts and accessible for up to 28 days
To export viewer analytics data:
- Set the time range and Split by selection you want to export data from.
- Select CSV in the header of the widget you want to export. The data behind that widget will download as a .csv file.
View and download town hall reports
After a town hall ends, look at town hall reports to see how many attendees were at your event, how long the event lasted, and average attendance time. See attendees’ roles, join and leave times, and how long they attended.
To view a town hall report:
- Select Calendar
in Teams.
- Open a past town hall's details.
- Select Reports.
- To view other town hall reports, select the date and time. Then, choose the date of the report you want to view.
- Select Download
 to save and download the report onto your device.
Presenter analytics
Presenter analytics empower organizers to monitor the health of presenter streams in real time, ensuring that content delivered to attendees is of the highest quality. To view presenter analytics, select Presenters View at the top left of the analytics dashboard.
Three controls at the top of Presenters View shape what you see:
- Time range sets the window of time you’ll see reports from.
- Refresh every sets the cadence at which the view pulls new data during a live event.
- Active Speakers narrows the view to the presenters who were speaking, which is useful when several presenters are connected but only one is live in front of the audience.
Camera Resolution
This shows the median webcam camera resolution of presenters.
App Sharing Resolution
This shows the median screen share resolution.
Presenters Broadcast Quality Over Time
This displays all presenters and their broadcast quality over time. Quality rating is based on issues presenters experience during the event highlighted in the Presenter Media Issues table.
- Green: Excellent
- Yellow: Good
- Red: Poor
Broadcast Quality Over Time
Shows broadcast quality for the current Split by selection, so you can compare a single presenter or source against the event as a whole.
Presenter Media Issues
Lists all issues experienced by presenters, such as a bad frame rate, based on Teams' real-time telemetry, as well as when each issue occurred during the event.
Breakdowns Table
Use Split by to group the table by None, Source, Presenter, or Presenter in Source. The table lists the number of samples collected for each row, how many of those samples were poor, the resulting poor rate, and how many presenters are represented in the row.
Select Rows/page to specify how many rows show on each page. Select CSV to download it.
Access
IT admins can access town hall insights, too. The town hall organizer can share the town hall insights URL with IT admins who have the following roles:
| Role | View analytics & reports | Account configuration | Silent tester |
|---|---|---|---|
| Global admin | Yes | Modify | Modify |
| Teams admin | Yes | Modify | Modify |
| Teams communications admin | Yes | Modify | Modify |
| Teams communications support engineer | Yes | Read | Read |
| Teams communications support specialist | Yes | Read | Read |
| Global reader | Yes | Read | Read |
| Reports reader | Yes | None | Read |