Sentiment and theme analysis in Viva Engage
Keep up with prevailing themes and conversations in your Viva Engage network with AI leveraged analytics: sentiment analysis, theme extraction, and content summarization.
Communities and storylines are vital channels for sharing work experiences, personal experiences, and conversations that matter. When analyzed as an aggregate, these conversations reveal insights that can help leaders calibrate their messaging and strategies in more adept and responsive ways.
Note: AI features are available in Viva Engage tenants that have a Viva Suite or an Employee Communications and Communities license.
Get started with AI in Advanced analytics
Important: These features require AI Summarization. Confirm with your Network administrator that this Viva Engage service is enabled on the network.
-
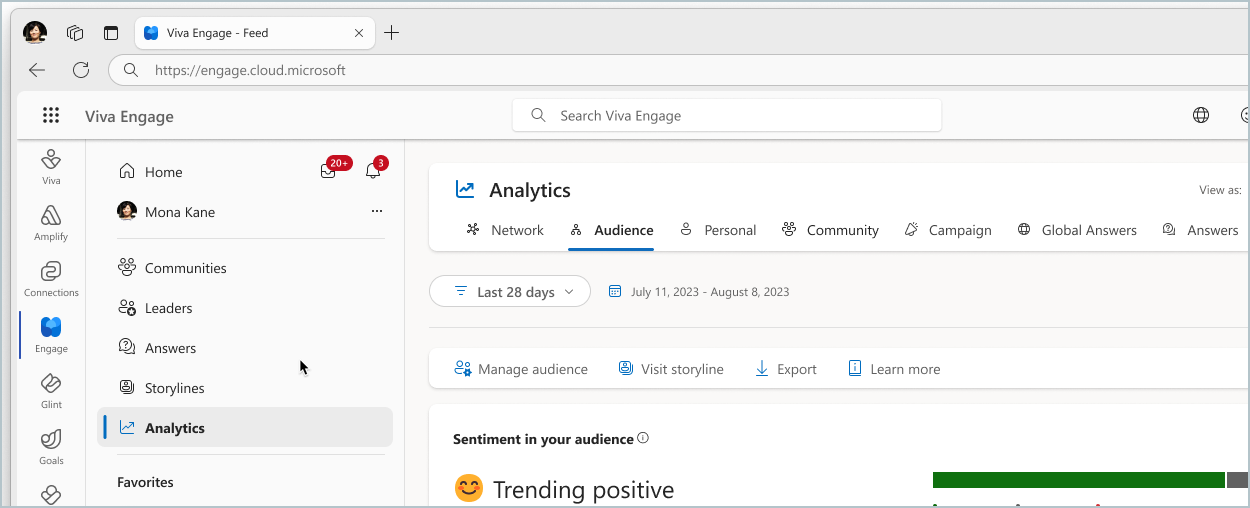
From the Viva Engage homepage, select Analytics from the left or view conversation analytics.
-
Depending on your permissions, do one of the following:
-
Creators can see conversation analytics on posts they create. Delegates can view conversation analytics on behalf of leaders. Community admins can see conversation analytics on any posts made within communities they manage.
-
Corporate communicators can navigate to Network analytics.
-
Leaders with one or more assigned primary audience can navigate to Audience analytics.
Note: Leader delegates can access Audience analytics from personal analytics: From your storyline, select the graph icon, and select the leader to whom you serve as delegate.
-
-
Set a time range to show conversations that occurred during that period.
How does it work?
To show audience sentiment and themes, Azure Cognitive Services (ACS) aggregates posts and comments from storylines and public posts. Individual messages are never shown. Users who belong to private communities can view aggregates of private posts from their respective communities in addition to aggregated public posts.
Note: Community admins can access this feature by visiting the Community analytics page.
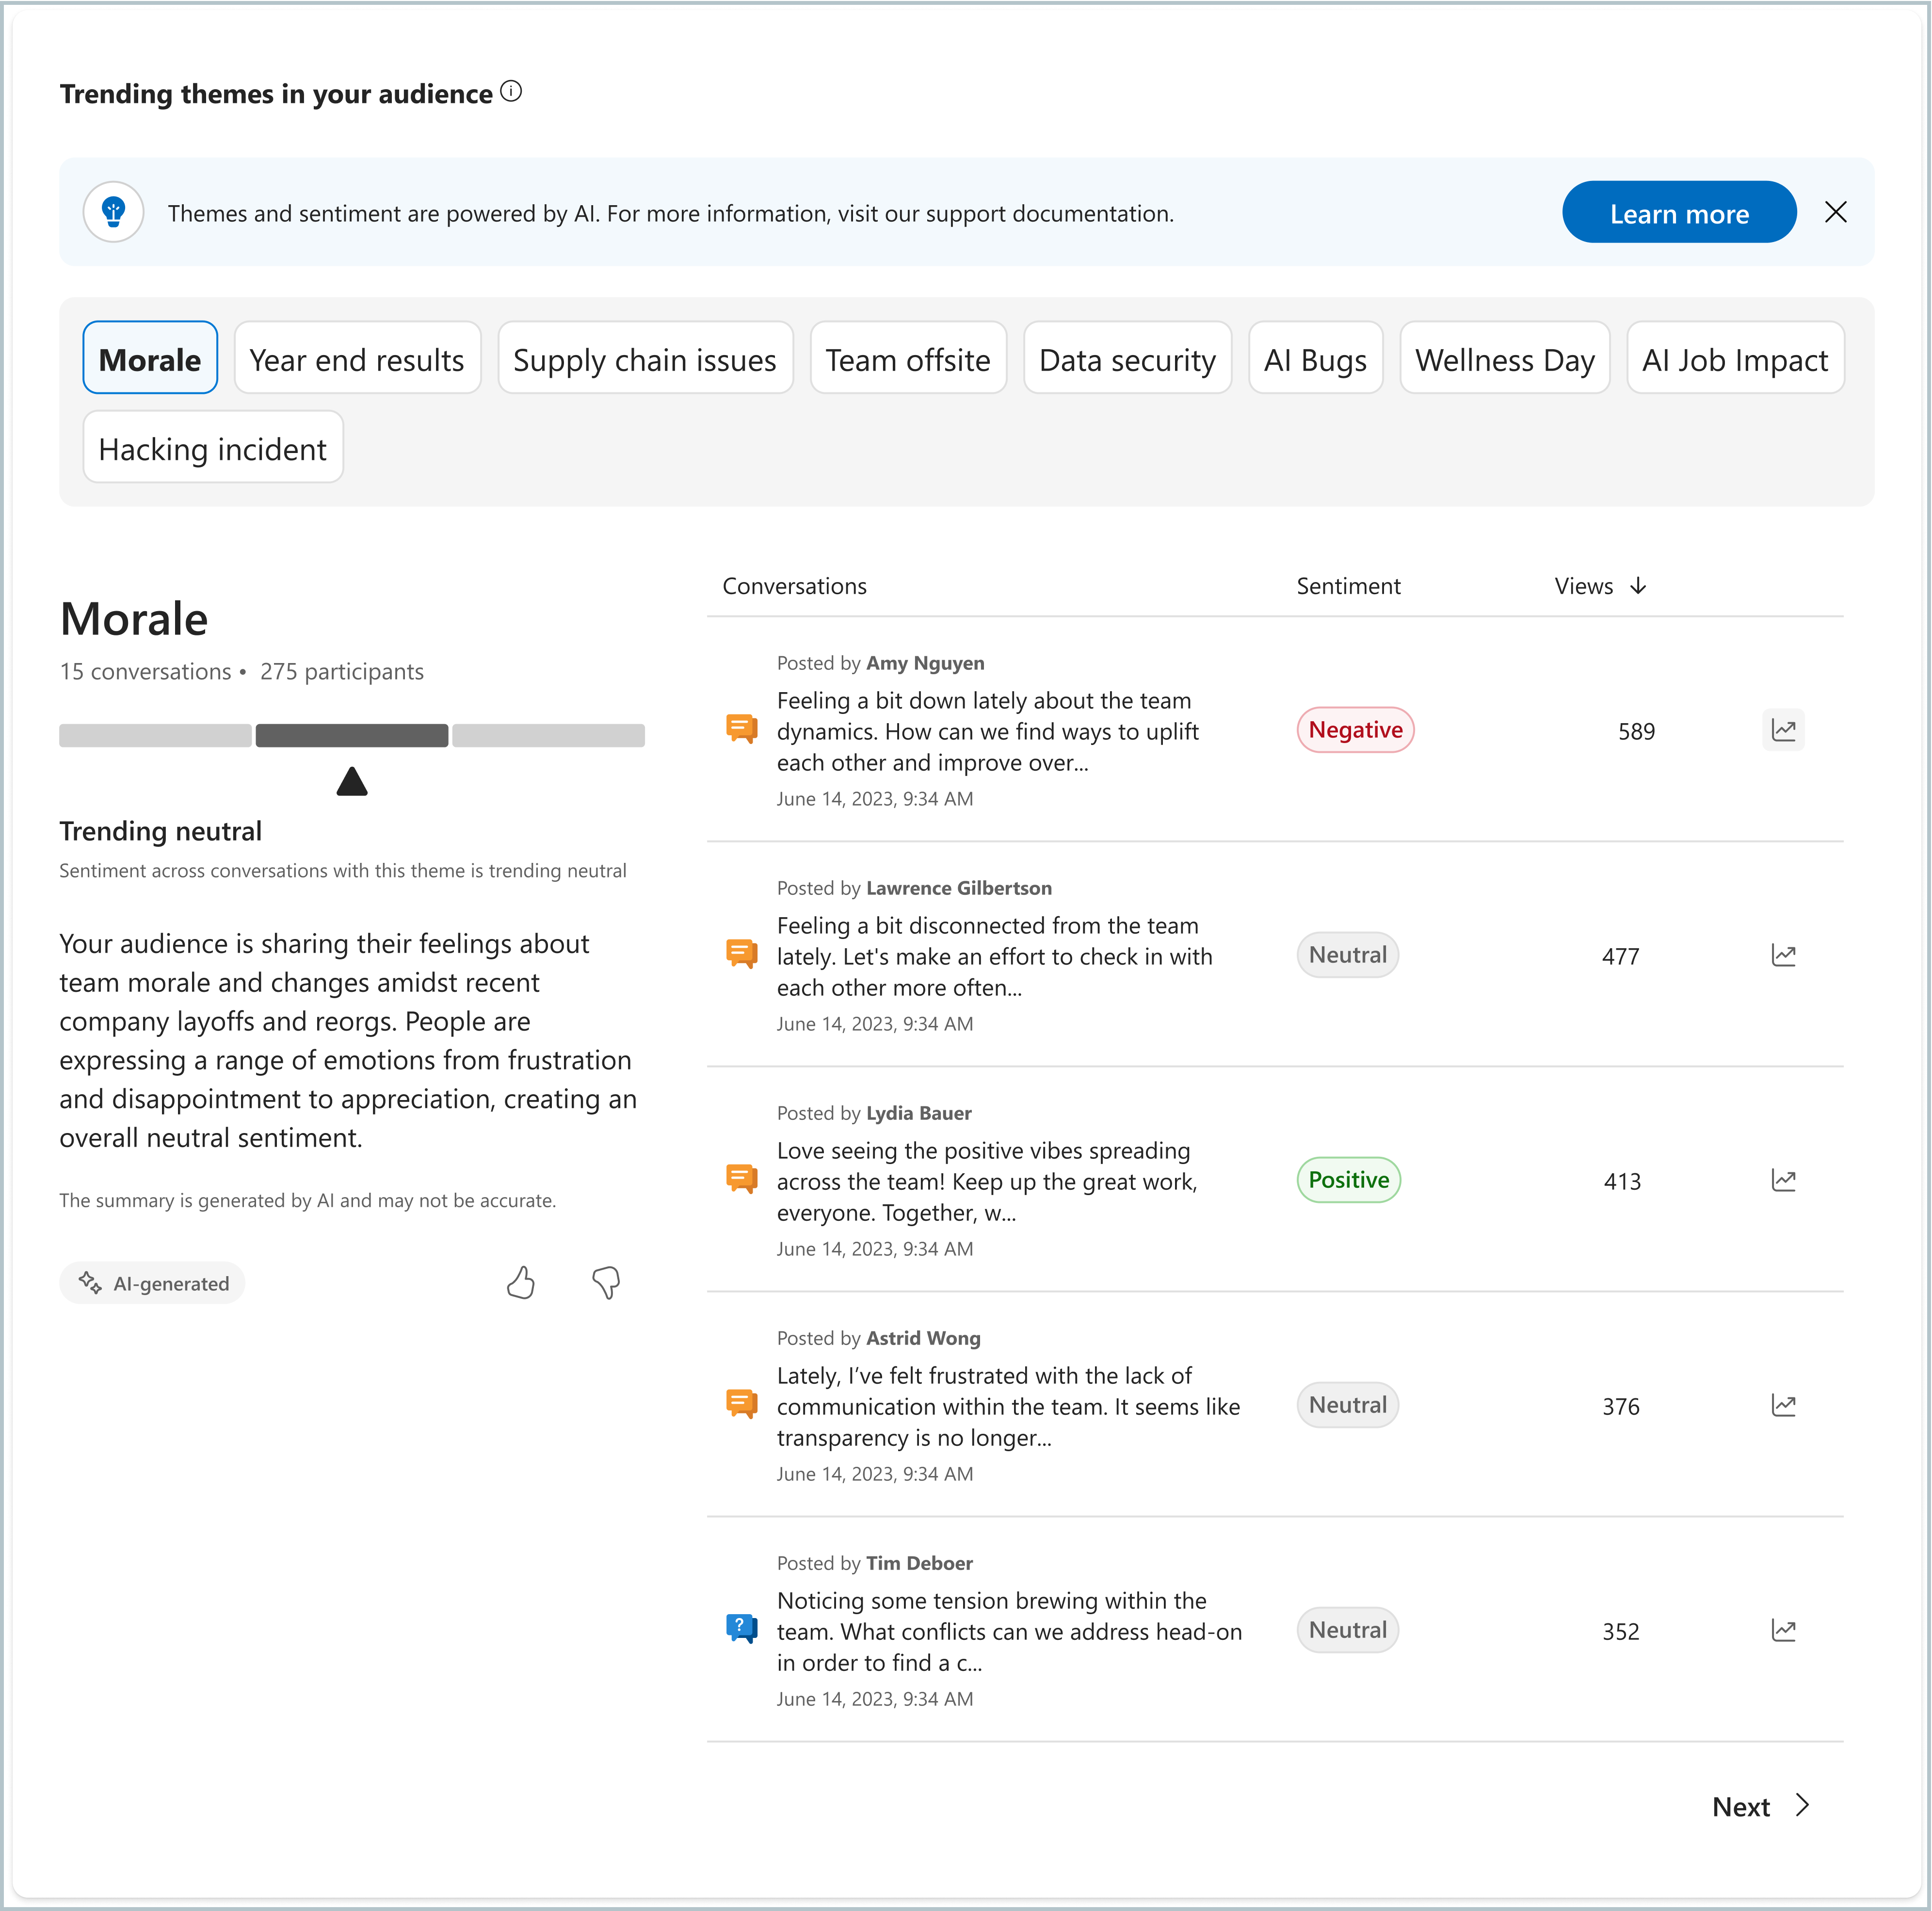
To surface frequently discussed subjects, the Viva Engage AI summarization platform uses generative AI within the network or the leader's audience for network and audience analytics, respectively. Through this underlying data we identify popular themes and summaries from the analyzed conversations. We combine this information with sentiment analysis to derive the sentiment most closely associated with the analyzed conversations.
|
Trending mixed |
The aggregate percent positive and aggregate percent negative are both greater than 25, or both are within 20 percentage points of each other. |
|
Trending positive |
The aggregate percent neutral is less than 70%, aggregate percent positive is higher than aggregate percent negative, and the criteria for Trending mixed is not met. |
|
Trending negative |
The aggregate percent neutral is less than 70%, aggregate percent negative is higher than aggregate percent positive, and the criteria for Trending mixed is not met. |
|
Trending neutral |
The aggregate percent neutral equals or is greater than 70%. |
|
Not available |
This message appears when the minimum privacy requirements have not been met. |
Promote privacy while surfacing trends
For sentiment analysis to show any results for the selected time period within network or audience analytics, there must be a minimum of:
-
20 individuals, and
-
five unique message writers.
For themes and sentiment analysis to show on conversation analytics, there must be a minimum of:
-
5 unique people posting 5 unique comments.
There are some additional cases in which the themes and sentiment analysis have insufficient data to display. These cases include:
-
Thread starters with no body or replies with insufficient content
-
Unauthorized viewer or missing premium license
-
Privacy settings and exclusions of users who have disabled AI summarization.
The percentage breakdown in overall Sentiment (positive, neutral, negative) doesn't show exact values below 5% or above 95%. These values appear as <5% and >95%.
These measures protect the privacy of individuals while providing insights to admins, corporate communicators, content creators, and leaders and their teams.
Troubleshoot why sentiment analytics don’t appear
When the Analytics hub shows no sentiment analytics, it may be due to a few different reasons:
-
You don’t have enough posts from unique users
-
You’re a K-12 customer. This feature isn’t available to K-12 customers
-
Your Viva Engage admin turned off the feature. Contact your admin to learn which analytics features are enabled in your network.
-
If a message is deleted, any aggregate sentiment score to which it contributed remains the same. However, future calculations won't include the deleted message. Also, once deleted, the message won't appear in a top conversations list.


